E-motion HMI dashboard proposal
As a part of the EMotion project, Media interaction Lab collaborated with WiVW and KTM E-technologies in the development of the HMI dashboard design for a new electric L-category vehicle. The presented content bellow served as the first proposal of visualisations that have since been developed further for final implementation.
All partners discussed the key features and generated sketches of ideas in 4 collaborative workshops led by WiVW. With the collection of these ideas, our lab started analysing them, looking for parallels and innovative approaches. Asking and answering questions like: What is the minimum amount of information a user requires to change his/hers driving in the moment? What is the best communication style for such information? Can we reduce the amount of information over time and eventually only show small hints to remind the user of more efficient driving behaviour? How can we correlate certain information to user’s possible needs in the moment and adapt our communication style accordingly? We finally visualised two ideas for each feature, as well as proposed an extension of certain information to the users’ smartphone.

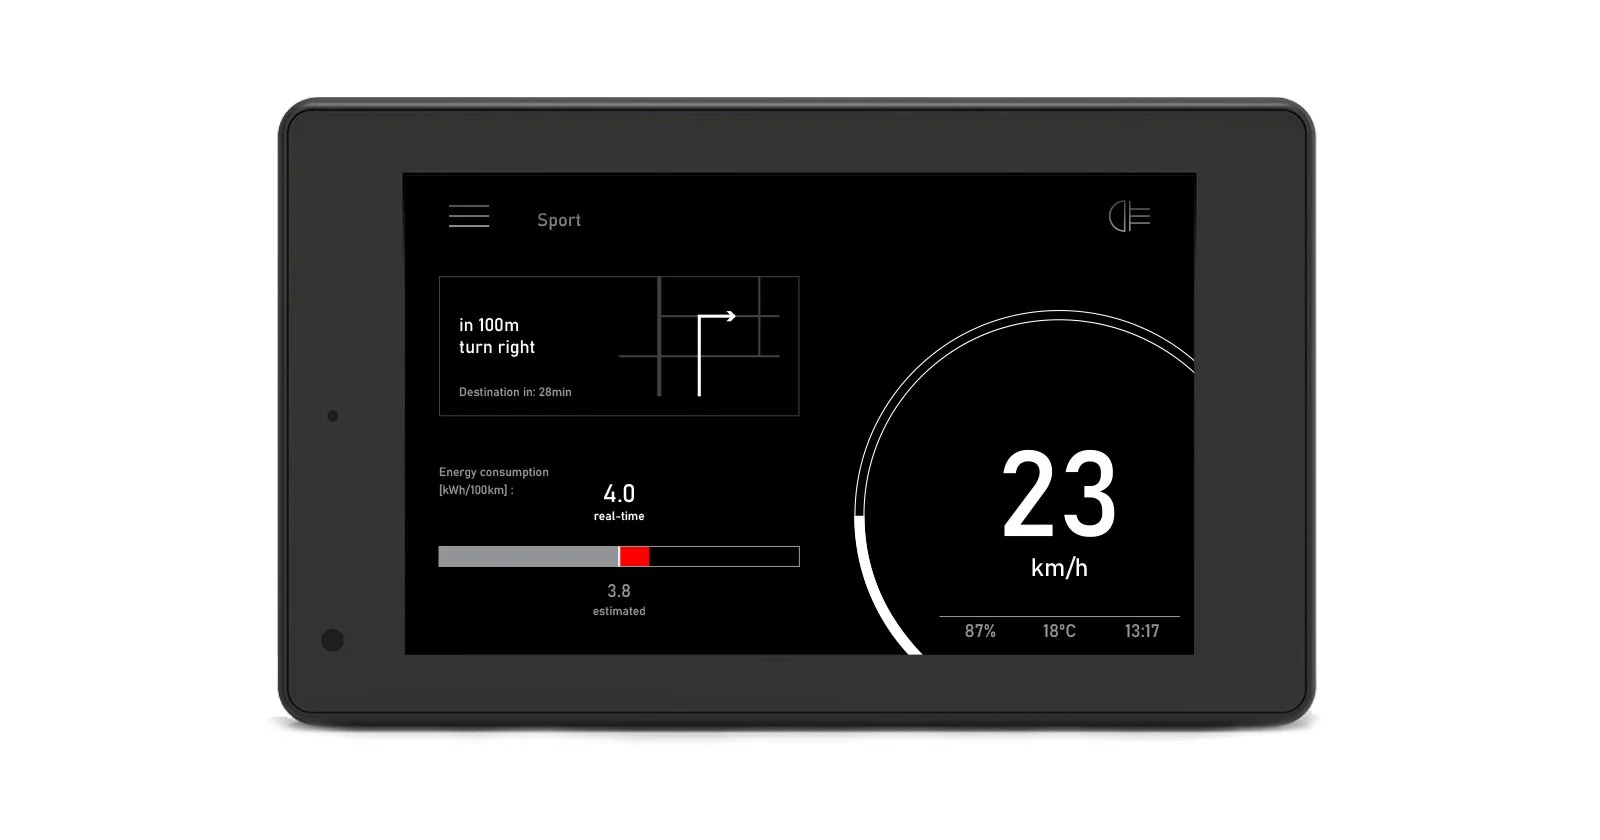
The basic layout was split into the left and right part, where the right showed basic information like current speed, temperature, time, etc. The left part was designed to display one of our primary features either alone or in combination with a secondary feature (usually navigation). Which one is displayed as primary depends on the driving mode (Eco, Normal, Sport), other contextual information (e.g. when battery charge drops below 20% the primary feature automatically changes to SOC), or is chosen by the driver in the Menu.

The visualisations show different approaches to communicate information and include icons and colours, as well as numbers and unit, and videos. In several visualisations we proposed presenting information in two states, an overview and more details on demand. We also imagined a smart system that could predict optimal consumption at any moments (based on location, driving mode, SOC, etc.) and display it over actual consumption, thus creating a small competition between the driver and the machine.
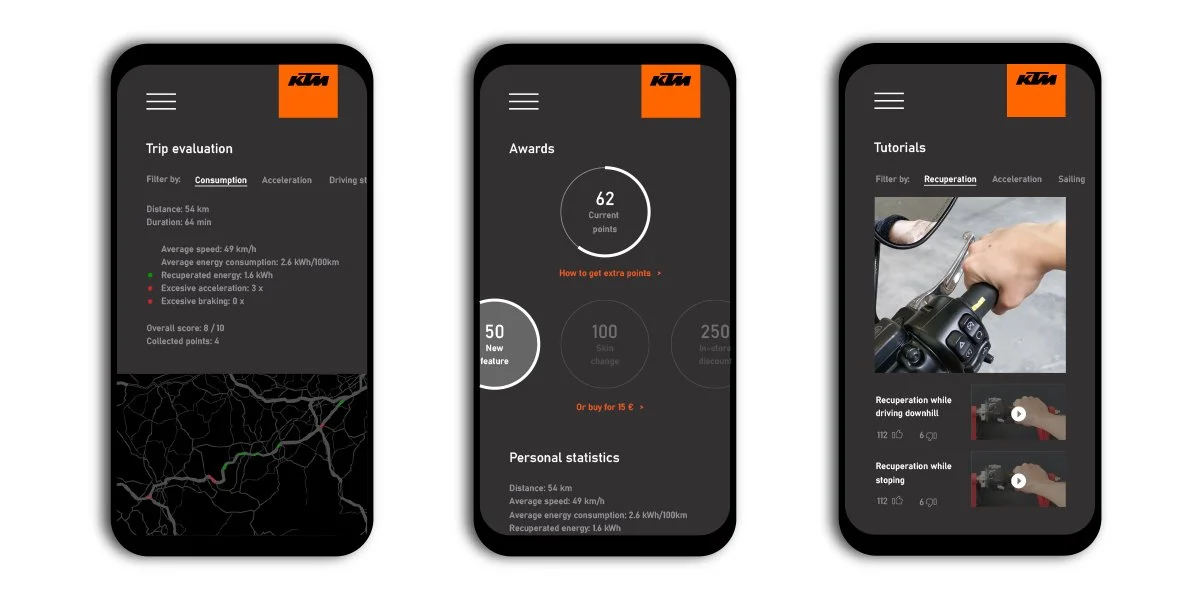
As mentioned, several features have been outsourced to a smart phone rather than displayed on the dashboard. In Trip evaluation for example, the driver can see their past trip through several filters e.g., where were they recuperating and how much energy they saved, where were they consuming too much energy, where were they braking or accelerating too excessively, etc.
The visualisations have not been implemented on the final dashboard, but served as visual aid in the studies WiVW has carried out, as well as initial input for the design agency that has developed the final road-ready design for the dashboard.
Team:
Sebastian Will and Dominik Mühlbacher (WIVW Würzburger Institut für Verkehrswissenschafte), Nicole Perterer and Martin Perterer (KTM E-Technologies), Sara Mlakar, Rainer Danner, and Michael Haller (FHOOE Media Interaction Lab)
Project coordination: Thomas Bäuml (AIT Austrian Institute of Technology)